A chapter title

2.1 Figures

2.1.1 Graphics
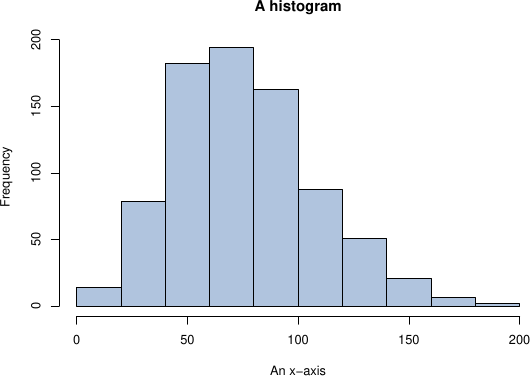
A plot titled "A histogram". The x axis is labelled "x-axis". The y axis is labelled "Frequency". The histogram shows a peak at a value of approximately 70.

Figure 2.1 A histogram originally provided in .pdf format

2.1.2 Tikz

A tikz figure showing a graph with 16 nodes. Each node is connected to every other node.
Figure 2.2 A complete graph, drawn with tikz.

2.2 Embedding

2.2.1 Numbas Embedding

2.2.2 Vimeo Embedding

2.2.3 Youtube Embedding

2.2.4 Embedded HTML

This raw HTML will be produced in the output directly.